To improve the performance of your supply chain, it is essential to have the right tools to support demand planning within your S&OP. Thus, you can limit stockouts and keep your inventory at a reasonable level while ensuring a high level of service. A key part of demand planning is getting the right forecast.
Very often, these forecasts come from salespeople and distributors, however, the quality of these forecasts is frequently questioned by supply chain professionals.
Focus on forecast KPIs for sales teams
In practice, it is necessary to measure the quality of these forecasts (the famous KPIs). But it's a difficult task to achieve with Excel. One can safely write, that there are as many ways of evaluating these forecasts that there are companies. We provide a performance tracking table below, to quickly identify items or levels in the organization requiring corrective action.
SKU Science provides a solution to educate all players in the supply chain to improve forecasting. It is possible to recreate this table by hand in Excel, but it is a complicated task and requires monthly maintenance. Several customers have asked us to be able to compare the forecasts provided by their sales departments with those calculated by our platform.
Hence, on this table, you can see 2 types of forecast. All the KPIs are calculated for the 2 two types of forecasts (depending on the lead times of your supply chain, otherwise it doesn't make any sense) and compared to each other to calculate the added value of your sales team.
Measure the forecast value-added of your teams
Your teams spend time forecasting, but it only makes sense if they really improve the forecasting from a tool like SKU Science or some other platform. By comparing these data, you finally know if you are adding value, which must be your only goal.
Concretely, how does this happen?
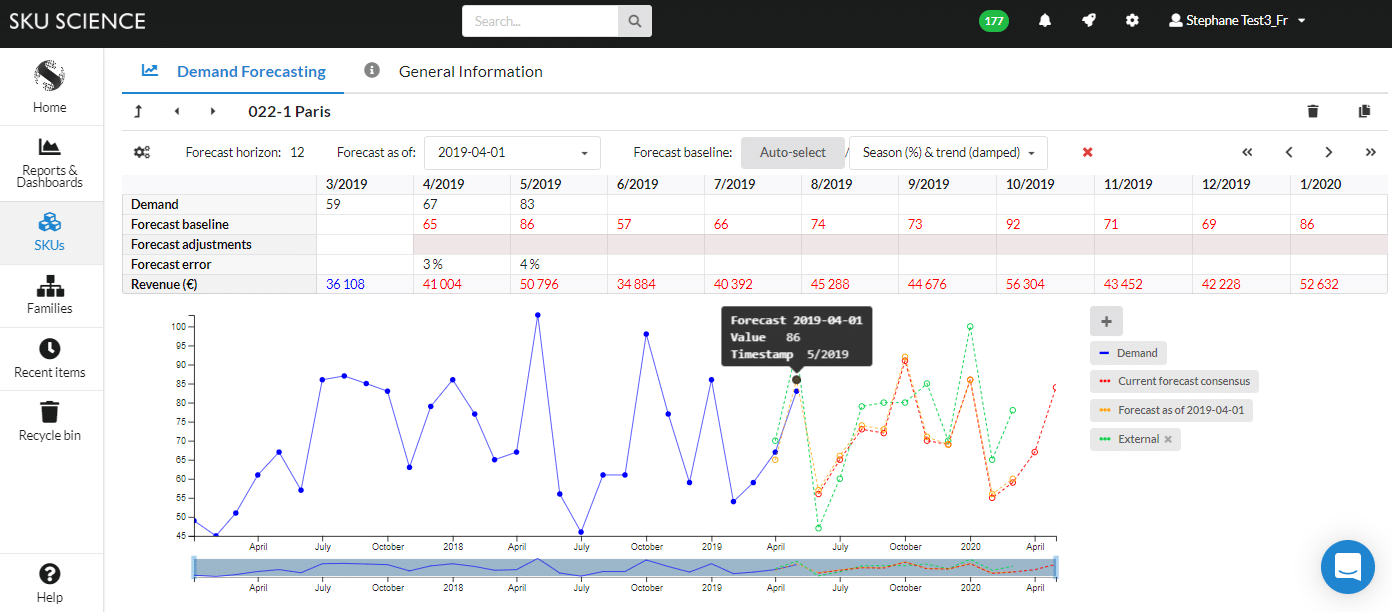
From historical demand data, the platform computes forecasts for the last cycles. During each cycle, a new external forecast was uploaded from Excel onto the platform. These rolling forecasts from both the platform and sales representatives are archived at each new cycle.
We analyze the forecast data with one month difference for each period in the example below.
Instead of focusing on forecasts at the SKU level (you can own a lot of them), we study forecasts at a more macroscopic level, such as a territory or a warehouse (in this case Paris). This exercise is replicable at any level.
The platform allows us to effortlessly obtain KPI tables calculated from quantities or financially valued.
In the example below, a weighted KPI table is generated from the revenue of each SKU. This remains the best option to analyze KPIs and have a real impact on the company.
Each calculated forecast KPI has 3 rows.
• SKU Science: indicates the values concerning the platform forecasts.
• User: indicates the values for the forecast from the sales department and uploaded to the platform.
• Value added: represents the improvement or degradation made by the user compared to SKU Science.
Forecast value-added and weighted KPIs
It is easy to see in this table that the teams' added value related to the forecast accuracy, in red, is 4% lower than the one obtained by the platform. Therefore, it is necessary to take corrective actions during the next cycles, to turn this figure into a positive. We will share some advice in another article to be successful. Without improvement in the next cycles, it is preferable not to change any platform's forecasts and to avoid wasting your teams' time.
Another important piece of information that can be extracted from this table is the average difference between the actual turnover for each period and the forecast bias. Here we see, thanks to the negative sign, that the sales department underestimates on average $ 634k per month compared to the actual turnover. Shortages are to be feared on certain items in the Paris area without a good inventory policy. A positive sign would indicate a tendency to overestimate quantities, which would inevitably result in an increase in inventory level. The ideal situation would be to have a percentage bias close to zero.
In general, it is good practice to analyze forecast KPIs against turnover or against the margin generated by the company.
For some key articles, however, it may be interesting to analyze this table from the perspective of quantities.