
Many companies do not have a process for archiving or tracking stockouts, even though they can have a significant impact on sales. This article will outline how organizations can minimize the effect of stockouts on demand forecasting through the use of aggregate forecast methods and actual sales data. While it would be preferable to use actual demand rather than historical sales by eliminating stockouts, our experience indicates that most companies have not yet reached this stage of maturity in their supply chain management.
Free Trial – Fast & Simple demand forecasting solution
Easy and affordable – No credit card required
Try SKU Science now !
Benefits of using aggregated data for demand forecasting
The best practice in supply chain management to achieve greater forecast accuracy is to calculate forecasts at an aggregate level. Here are some reasons why demand forecasting KPIs typically improve with this approach:
– Increased sample size: By aggregating data from multiple sources, you increase the sample size of your data, which can improve the accuracy of your forecasts. A larger sample size can provide a more representative view of the population, allowing for more robust and reliable predictions.
– Reduction of noise: Aggregating data can help reduce the effects of noise and outliers in the data. For example, if you’re forecasting demand for a product, an unusually high demand from a single customer or location might skew the data and lead to an inaccurate forecast. By aggregating data across multiple customers or locations, you can reduce the impact of these outliers and produce more accurate forecasts.
– Better understanding of underlying patterns: Aggregating data can help you identify patterns and trends that you might not see when working with individual data points. For example, if you’re forecasting demand for a product across multiple stores, you might notice that demand tends to be higher on weekends or during certain months of the year. By identifying these patterns, you can create more accurate forecasts.
– More explanatory power: Aggregating data can give you a more complete understanding of the factors that influence demand for a product or service. For example, by analyzing data from multiple stores, you may be able to identify both a seasonal pattern and store-specific characteristics that affect demand. Combining these two factors can provide more explanatory power and more accurate forecasts.
Effective data grouping techniques for accurate demand forecasting
Now let’s see what type of data we could use to group our data in order to apply our forecasting models.
– Product data such as product size, weight, color, price, brand, segment, category, or any other field characterizing a product can be used to aggregate data.
– Store data can also be used to understand how demand for a product varies across different store locations. This can include information such as store size, layout, and demographics of the surrounding area.
– Sales channel is another example of information that can be used to organize your data before computing the forecast since the demand for specific channels can be very different.
– Marketing data such as promotions or advertisements that were run for the product, can help understand the effect of these activities on demand.
Therefore, grouping data using these fields or a combination of these fields can lead to better accuracy when forecasting demand.
Improving demand forecasting accuracy through aggregate data and stockout analysis
If historical sales data is impacted by stockouts, it can lead to inaccuracies in demand forecasting because stockouts can cause fluctuations in sales that do not reflect true underlying demand. As seen earlier, working with aggregate data can help improve the accuracy of demand forecasting in this situation for a few reasons:
– Smoothing effect: Aggregating sales data from multiple sources can help to smooth out fluctuations in sales caused by individual stockouts. For example, if sales data from one store is affected by a stockout, it can be offset by sales data from another store where stockouts did not occur.
– Better understanding of the impact of stockouts: By aggregating data across multiple stores, you can also gain a better understanding of how stockouts are impacting demand. This can help you to identify which products are most affected by stockouts, as well as which stores or regions are more affected, you can use this information to plan and manage your inventory.
– Reduced variability: Stockouts can cause significant variability in sales data, which can be especially problematic for statistical forecasting methods that rely on historical data. By aggregating data, you can help to reduce this variability, which can improve the accuracy of your forecasts.
It’s important to note that even when working with aggregate data if stockouts are a frequent and persistent problem, it can make the forecasting process more challenging, and it’s important to consider ways to address the root causes of stockouts to improve forecast accuracy.
Free Trial – Fast & Simple demand forecasting solution
Easy and affordable – No credit card required
Try SKU Science now !
Gains on forecasting KPIs for our customers
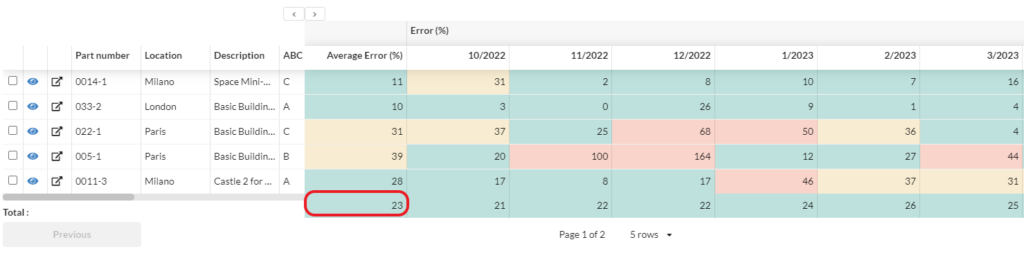
As discussed earlier, there are several possible options for aggregating data to calculate the aggregate forecast, each with a specific error rate. It is important to consider several options and choose the most appropriate one for your needs. Forecast KPIs such as bias and error will help you identify the best level of aggregation for your calculations. However, it can be challenging to split aggregate forecast data into underlying forecasts for each period, which can be time-consuming and may result in inaccuracies.
SKU Science has developed a fully automated feature that computes underlying forecasts for each period, making it easy to compare error rates and choose the relevant aggregate level. Our customers have been using this feature to lower their error rates and improve the accuracy of their demand forecasting. The impact can be significant, as we have seen up to 20% fewer errors for some datasets. By leveraging the power of aggregate forecasting, businesses can make more informed decisions and optimize their inventory management strategies, ultimately improving their bottom line.
If you want to know more, feel free to book a meeting with us.