fbpx

How to improve your S&OP thanks to forecast KPI


The S&OP process requires the correct use of demand forecasting methods, as described in previous articles. However, it is essential to efficiently monitor forecasts accuracy in order to improve your supply chain performance. If the forecast accuracy level is low, the production planning process will be impacted causing excessive inventories or product shortages and availability, with consequent delays in deliveries to customers, or in worst cases loss of sales and business.

Within this context, selecting indicators to adequately evaluate and monitor the accuracy of a demand forecasting process must be implemented as a key practice. However, this task may be complex, and SKU Science can help you achieve this goal. Some important concepts need to be considered before defining how KPI will be measured, in order to get the most value from their results. Here we present some approaches and methods, with their main characteristics, advantages, and shortcomings.

Try our fast & simple demand forecasting solution
Sign up for free to SKU Science today!
Pre-loaded sample data - No credit card required

Key Reliability Parameters

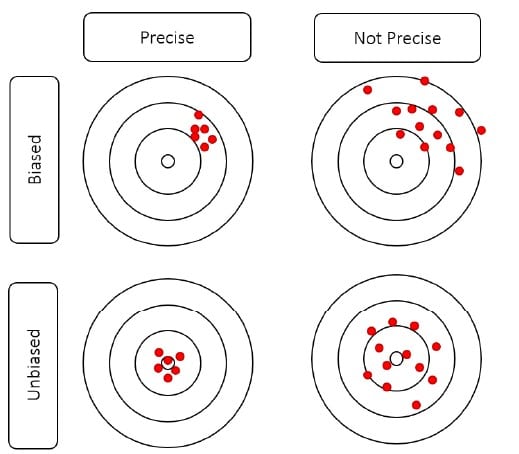
The first concept to be aware of is the difference between the precision of a forecast and its bias.
First of all, the error is defined as the forecast minus the demand.

e_{t}=f_{t}-d_{t}

Our First Forecast KPI: The BIAS

The BIAS will represent the historical average error, indicating the overall error direction.

bias=\frac{1}{n}\sum_n e_t

The precision will measure how much spread you will have between the forecast and the actual value, indicating the magnitude of errors, which can be visualized in figure 1.

Figure 1: Precision and Bias.

Hence, the performance of your forecast accuracy indicator can be evaluated for its effectiveness through a quantitative criterion. This will enable you to make better decisions on adjustments, or will direct you toward the use of another metric.

MAPE: The Mean Absolute Percentage Error

This KPI is measured by the sum of the individual absolute errors divided by the demand (each period separately). This model divides each error individually by the demand; so the main disadvantage of this is that high error levels during low demand periods will have a major impact on its result, compromising the effectiveness of your forecast. For this reason, we recommend your avoiding this particular KPI.

MAPE=\frac{1}{n}\sum\frac{|e_t|}{d_t}

MAE: The Mean Absolute Error
MAD: The Mean Absolute Deviation

MAE and MAD are similar. These forecast KPIs are defined by means of absolute error. However, since they are not scaled to the average demand, the result is an absolute number which cannot help directly determine if your demand forecast is good or bad—unless you are fully familiar with numbers from your business. To resolve this issue, it is common practice to divide the MAE by the average demand in order to get a percentage indicator, which then provides a very good KPI to measure your forecast accuracy.

MAE=\frac{1}{n}\sum{|e_t|}

RMSE: The Root Mean Square Error

RMSE is defined as the square root of the average squared error. Just as for MAE, it is not scaled to the demand, and therefore should be similarly adjusted by the average demand to produce a percentage indicator.

RMSE = \sqrt{\frac{ \sum e_t^2  }{n}}

Compared to MAE, RMSE does not treat each error in the same way and gives more importance to the biggest errors, so one big error will be sufficient to get a very bad RMSE result.

Try our fast & simple demand forecasting solution
Sign up for free to SKU Science today!
Pre-loaded sample data - No credit card required

Important Factors to Consider When Choosing Forecast KPI Measurement

When comparing all forecast KPI alternatives, you may have noted that MAPE should be avoided as it allocates a high weight to forecast errors when demand is low. This situation is not observed on the other two, as MAE targets the median demand, while the RMSE aims at the average demand.

But what then would be the best alternative? For many products, you will observe that the median is not the same as the average demand, particularly with seasonal markets. This means that a median based forecast like the MAE will generate a bias, resulting in a high offset compared with the actual demand.
RMSE, on the other hand, is not free either of a few shortcomings. As seen earlier, RMSE gives greater importance to the highest errors. This comes at a cost: sensitivity to outliers. For example, one exceptional month on a certain product demand will, due to external factors, strongly impact the average demand, and impact in turn, the reliability of the RMSE measurement.

Additionally, intermittent demand, which is common to many supply chains, should be taken into consideration. If your demand doesn’t follow any common pattern, the median will not be a reliable way to analyze its evolution, and therefore the MAE should not be used in these cases.

Considerations for Starting Your First Forecast Accuracy KPI

In conclusion, MAE provides good protection against outliers, whereas RMSE will procure an unbiased forecast. Additionally, if your business deals with low-demand items on a weekly basis, you should consider aggregating the demand to a higher time horizon, using monthly or even quarterly periods in order to get better forecast results.

As you may have already noticed, choosing which forecast KPI to use is not that easy and there isn’t a definitive answer. You should experiment and adjust your parameters based on your learning curve, checking both the BIAS and the precision of the chosen error model.

Knowing some characteristics of your demand will start you off in the right direction: Does your business have a constant or seasonal demand? How susceptible is your market to outliers? Do you face any intermittent demand? Based on management experience and the overall knowledge of your business, answering these questions will not be difficult. You are now ready to try various options.

Most importantly, keep in mind the importance of a proper forecast accuracy indicator as a key tool to manage your demand forecasting process. SKU Science can definitely help you select the appropriate KPI to optimize your S&OP.

Additional details about these supply chain KPI and one example can be found on  supchains.com.

Bibliographical Reference: “Data Science for Supply Chain Forecast – Nicolas Vandeput”