
Most supply chains expect some demand variability and therefore, one must choose the correct forecast model, as can be seen in our previous articles. Regardless of the nature of this variance, exceptional factors may happen, and can seriously impair the reliability of a given model. We call these data “outliers”.
These outliers result firstly from exceptional demand, such as stock liquidations, temporary stops in production, or external restrictions, which may be due to logistical or infrastructural constraints making both the composition of the stock or the fulfillment of customer orders temporarily impossible. Even though some demand observations are real, it does not mean they are not exceptional and shouldn’t be cleaned
Secondly, there are also mistakes and errors, which are obvious outliers. If you spot these kinds of errors or encoding mistakes, you need to implement process improvements in order to prevent them from happening again.
Considering the negative effects outliers can bring to your business, knowing how to detect them is essential and there are some techniques that can be used to address this issue.
Try our fast & simple demand forecasting solution
Sign up for free to SKU Science today!
Pre-loaded sample date – No credit card required
Winsorization
This first idea is a rather simplistic approach of defining a certain minimum and maximum range in which the data will simply be disregarded. Statistically, this margin is defined as the percentile, which means the value below which x% of the observations in a group will fall. For example, 99% of the demand observations for a product will be lower than its 99th percentile.
This approach may be efficient, but it can also result in some problems, such as detecting fake outliers in a dataset without outliers (see figure 1 below); or in the case of real outliers, it doesn’t sufficiently reduce the value keeping it at a level way above our expectation. It is an approach that ends up requiring a very accurate critical analysis by the planner, so it is not as efficient and reliable as it should be, as it would take out the high and low values of a dataset, even if they aren’t exceptional per se.
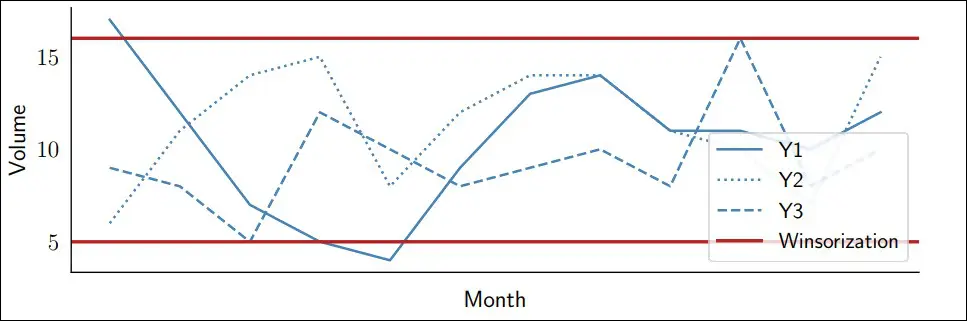
Figure 1: Winsorization of a simple dataset without outlier
Standard Deviation
Another approach would be to use the demand variation around the historical average and exclude the values that are exceptionally far from this average, according to a certain range between two thresholds centered on the demand.
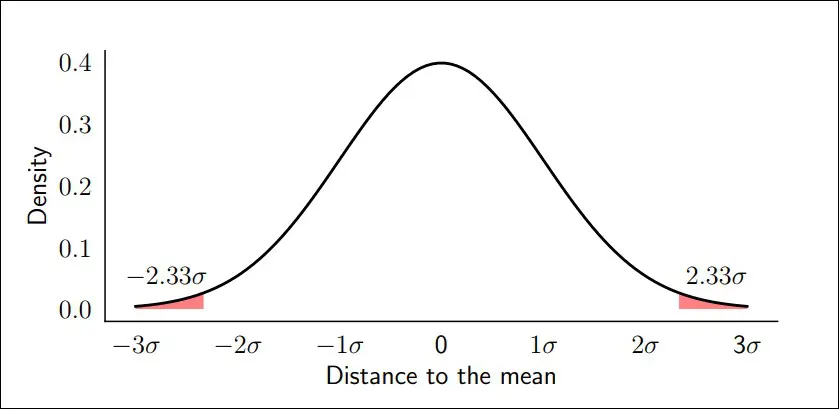
Figure 2: Distance to the mean
With this method, in a situation without outliers, we do not change any demand observation (we keep all values in this case), and in another situation with an outlier (see Y2 below), we do not change the low or high demand points but only the actual outlier (from 100 to 49 in the figure below).
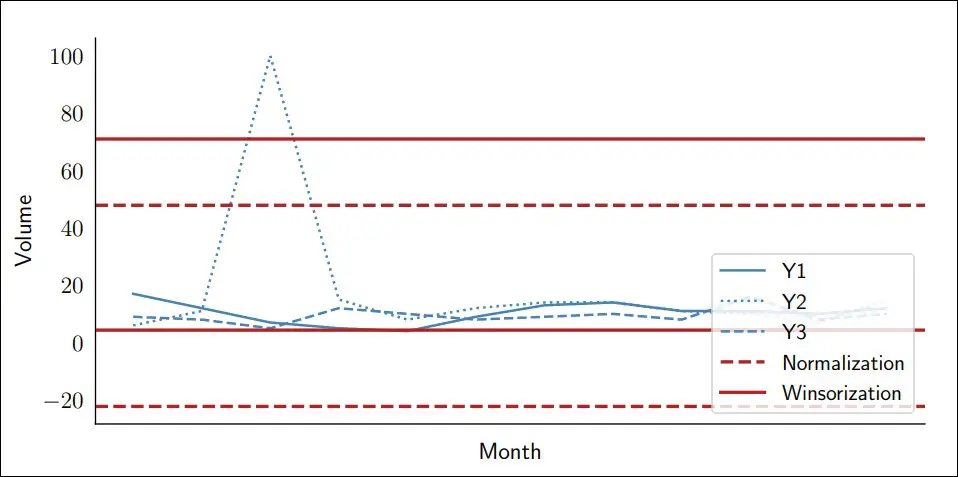
Figure 3: Outlier detection based on standard deviation (Normalization)
Although it may seem to solve all the issues arising from the Winsorization approach, the actual limitation will arise when you have a product with a trend or seasonality. In this case, its historical average will not accurately represent the actual average for that given period, and consequently the thresholds may not correctly limit a possible outlier.
Error standard deviation
In order to solve the drawbacks from the Standard Deviation and Winsorization let’s go back to the definition of an outlier. An outlier is a value that you didn’t expect. In other words, it is a value far away from your prediction (i.e. your forecast). To spot outliers, we must therefore analyze the forecast error and see which periods are exceptionally wrong. If we compute the error for our forecast we would obtain a mean error and a standard deviation. You can refer to the book Data Science for Supply Chain Forecast, by Nicolas Vandeput to see real-life examples and more details. The figure below illustrates our results obtained from our forecast.
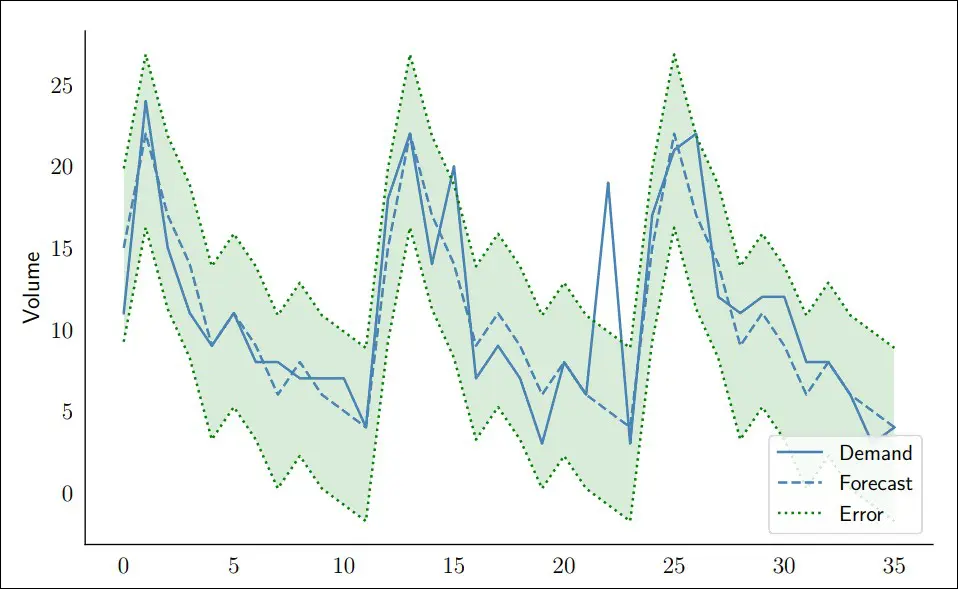
Figure 4: Outlier detection via forecast error
This smarter detection method, which analyzes the forecast error deviation instead of simply the demand variation around the mean, is able to flag the outliers much more precisely and reduce them back to a plausible value. Therefore, this should be your preferred method for accurate demand forecasting.
Try our fast & simple demand forecasting solution
Sign up for free to SKU Science today!
Pre-loaded sample date – No credit card required