Forecasting demand is always a means to an end, not the end itself. A forecast is only relevant if it enables a supply chain to take appropriate actions. A good forecasting model should allow your supply chain to improve its service level, plan better, reduce waste, and overall costs. In this blog article, we introduce the 4-dimension demand forecasting framework to help you define the appropriate process for your organization.
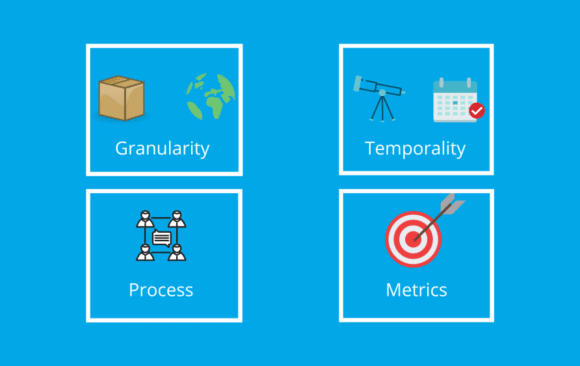
When setting up a demand forecasting process, you will have to set it across four dimensions: granularity, temporality, metrics, and process.

1. Granularity
You should first work on determining the right geographical and material granularity for your forecast.
?️ Geographical. Should you forecast per country, region, market, channel, customer segment, warehouse, store?
? Material. Should you forecast per product, segment, brand, value, raw material required?
To answer those questions, you have to think about the decisions taken by your supply chain based on this forecast. Remember, a forecast is only relevant if it helps your supply chain to take action. As an example, let’s assume you need to decide which products to ship from your plant to your regional warehouses. In that case, it might be a good idea to aggregate demand per each region allocated to a warehouse and forecast demand directly at this geographical level. To forecast the demand allocated to a warehouse, it is a bad practice to use historical orders as they are impacted by logistic constraints. Instead, you should forecast the warehouse demand based on what should be served from the warehouse if there were no constraints (in other words, forecast the demand coming from the geographical region that should be served by the warehouse).

Free trial - Fast & simple demand forecasting solution
Easy and affordable - No credit card required
Try SKU Science now!
2. Temporality
Once you know at what granularity level you will be working on, you should pick the right forecasting horizon and temporal aggregation (time bucket). Many supply chains stick to forecast demand 18 or 24 months ahead, although you may need to pick a limited horizon to focus on.
?️ Temporal Aggregation. What temporal aggregation bucket should you use (day, week, month, quarter or year)?
? Horizon. How many periods do you need to forecast (one month, six months, two years)?
Again, you should answer these questions by thinking about what your supply chain is trying to optimize/achieve and the lead times involved with these decisions. For example, let’s assume your suppliers (or production plants) need to receive monthly orders/forecasts three months in advance. In that case, you know you should work on monthly buckets and with a horizon of 3 months (M+1/+2/+3). You can also skip M+4 (or at least not focus on it). If you need a forecast to know what goods to ship from your central warehouse to your local warehouses, you should focus on a horizon equivalent to your internal lead time.
❗ Models and Forecasting Horizon. Statistical models can easily produce forecasts over a very long horizon (theoretically infinite). This is not the case with machine learning models. So, you might have to stick to statistical models for long-term forecasting.
3. Metrics
Usually, practitioners overlook the question of forecasting metrics. Choosing the right metrics for a forecasting process/model is actually quite simple and will have profound impacts on the resulting forecasts. Depending on the metric selected, you might give too much importance to outliers (the RMSE flaw) or risk a biased forecast (the MAE flaw). Here are a few pieces of advice to choose the right forecasting metrics:
❌ Avoid MAPE. Many practitioners still use MAPE as a forecasting metric. This is a highly skewed indicator that will promote underforecasting.
✅ Combine KPIs. Choosing a combination of KPIs (such as MAE & Bias) will often be a good compromise enabling you to track accuracy and Bias while avoiding most pitfalls.
✅ Track consistent Bias. If a consistent bias (over/under forecasting) is observed on an item, something is probably wrong with the model/forecasting process.
? Weighted KPIs. You can try weighting each product (or SKU) in the overall metric calculation based on its profitability, cost, or overall supply chain impact. The idea is that you want to pay more attention to SKUs that matter the most.
Beyond the math, it is important to align the forecasting KPIs to the required material and temporal granularities. For example, let’s assume you are interested in ordering goods from an overseas supplier with a lead time of 3 months. In that case, you should measure accuracy over a forecasting horizon at months +1,+2, and +3–or even better, calculate the cumulative error over three months–instead of merely looking at the accuracy achieved at month+1.
4. Demand forecasting process
Now that you know your material and temporal aggregation, horizon, and metrics, you can set up a process. This process should be defined through three specific aspects.
- Stakeholders. Who will review the forecast?
Bringing different points of view to the table – using various information sources – will help create a more accurate forecast.
- Periodicity. When do you review the forecast?
Updating your forecast more often might improve its accuracy (as you have fresher data at hand). Updating it too often might create chaos as you overreact to demand changes and consume too many resources for a limited added value.
- Review Process. How do you review the forecast?
At the core of any forecasting process, there should be a measurement of the forecast value-added. Tracking each team member’s value-added will enable you to improve the forecasting process efficiency (and refine the relevant forecasting periodicity and stakeholders).
? Forecast Value Added Framework. A forecasting process framework that tracks each team/process step’s added value compared to a benchmark (or the previous team’s input). It was imagined and promoted by Michael Gilliland in the 2010s (see his book here).
Our advice for your demand forecasting process
- Short-term forecast. Let’s assume you need to decide every week what to ship to your stores. The forecast could be updated every week, with a horizon of a few weeks ahead. The granularity would be SKU per store. As you need to populate the forecast every week, the time to review it will be limited. Henceforth, only a few demand planners should validate it. Black-box machine learning models should typically be preferred here.
- Mid-term forecast. You want to assess what to produce in the coming months. This is your typical S&OP forecast where you need to gather inputs from many stakeholders (sales, finance, marketing, planners, clients, suppliers). The forecast can be generated (and its accuracy measured) at a global level per SKU and once per month.
- Long-term forecast. You need to set the budget for the upcoming year. This is a long-term forecast at a very aggregated level (most likely done at a value/revenue level per brand/segmented). To create various scenarios (based on pricing, marketing, new product introduction), you will want to use a causal model where the weight of inputs can be set and discussed. Machine learning models should be avoided as they are a black box and struggle to forecast over the long-term due to lack of data.
You can refer to the book Data Science for Supply Chain Forecast, by Nicolas Vandeput to see real-life examples and more details.


