
The COVID-19 crisis has impacted all demand forecasting models, whatever your industry. Depending on the type of items you’re dealing with (low vs high demand) or your industry sector (retail, food, health care, utilities, logistic, manufacturing etc.), some measures need to be taken in order to plan (relatively) accurately for the months to come.
The question is: “How should we treat actual demand data for March, April, and May 2020?”
Well, as you can imagine, there is not a single answer to this question, but we will try below to list all available options. We’re pretty sure that one will fit your business.
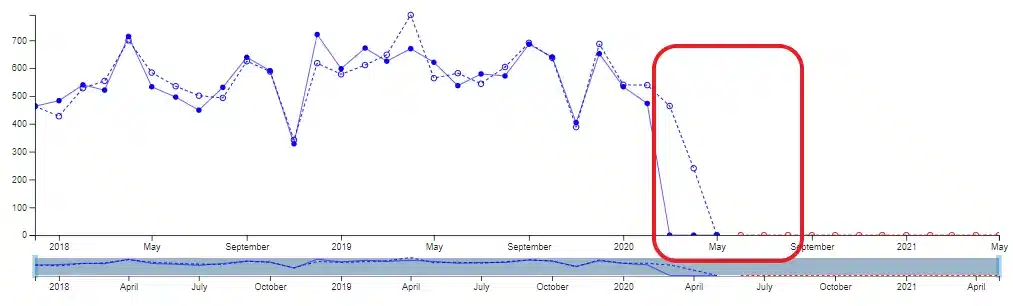
The first obvious option is to tag these values as outliers. If you decide to treat March to May 2020 demand data as outliers, you then have several options for your forecast calculations.
• You can remove them from the forecasting window.
• You can implement some tactics to reduce their weight in your forecast models.
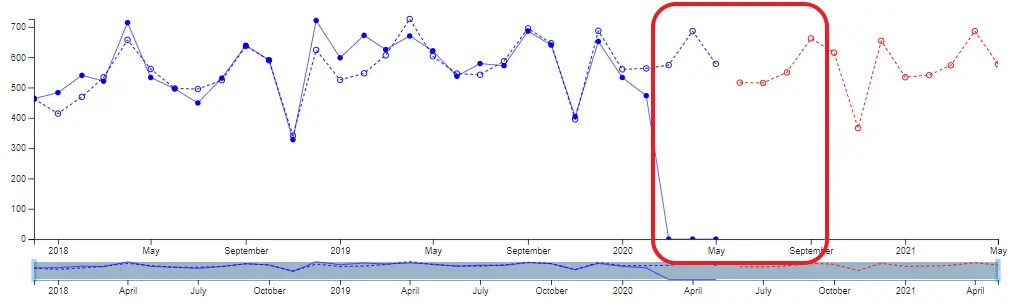
• You can use historical data from previous years to replace these particular periods, by taking an average from 2017 – 2019 as an example.
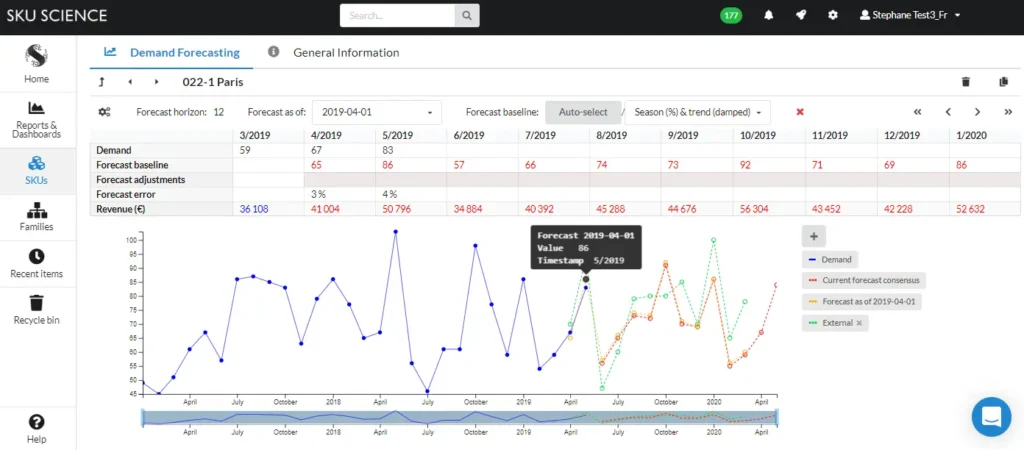
• You can use calculated forecast data from your model to replace these particular values. We will explain soon in another article how to quickly obtain your forecasts using this method with SKU Science.
Once your tactical choice is made – and taking into account that we are still in a VUCA world – you may consider allowing your forecast baseline to quickly adjust to changes in demand by increasing forecast parameters sensitivity.
Dealing with Q1 and Q2, 2020 demand data will not just help you to properly plan for the rest of the year but also for Q1 and Q2, 2021. Indeed, for those with a seasonal demand, it is likely that your forecast models will “learn” a COVID-19 seasonality and predict a demand drop in March – May 2021.
For some industries, flagging the lockdown months as outliers is not always the best option, because those sales could represent a new structural change that is likely to persist into the future – video conferencing solutions and medical teleconsultations spring to mind. Another example is an increased consumption of flour that could remain at this higher level in the months to come, as home cooking has gained the upper hand over fast food and eating out. Therefore, it is important for demand planners to know their industry so that they can properly interpret historical demand. In short, flagging recent demand as outliers is counterproductive if your customers have now changed their long-term behavior due to the crisis.
Try our fast & simple demand forecasting solution
Sign up for free to SKU Science today!
Pre-loaded sample date – No credit card required
Another tactic to optimize your sales – while optimizing your working capital – would be to maintain low inventory levels for end products while maintaining a good level of raw material and WIP to allow for a rapid production ramp–up, in order to stay ahead if a demand increase arises.
In conclusion, there is no forecasting silver bullet that is effective for all businesses. The demand over the last 3 months has been exceptional: it is likely that, in most cases, the post-COVID-19 demand will be different from the demand we have experienced during the last 3 months. Hence – except for some essential industries (e-commerce and food etc.) – it would be a safe bet to alter the demand data for March, April, and even May. If you currently use a statistical or a black–box algorithm it might be time to review how your forecast engine works to prevent it from overreacting to the COVID-19 crisis.